Introduction to Writing a Graph Description for IELTS Task 1. A Step-by-Step Guide to Mastering IELTS Graph Descriptions – Free Printable PDFs
Introduction to Writing a Graph Description for IELTS Task 1

Introduction to Writing a Graph Description for IELTS Task 1
For the IELTS writing test, you are required to complete two writing tasks. Task 1 is a data report, while Task 2 is an essay. You may already be familiar with essay writing, but writing a graph description requires a different approach. In this guide, we’ll explore how to effectively describe a graph for IELTS Task 1 and provide a free printable PDF with key writing steps.
Understanding IELTS Writing Task 1
Not every IELTS Task 1 will require you to describe a graph—sometimes, you may need to analyze a table, chart, diagram, or flowchart. However, the organizational principles and writing steps remain the same.
Let’s start with an example and break it down into steps so you can practice writing your own graph descriptions.
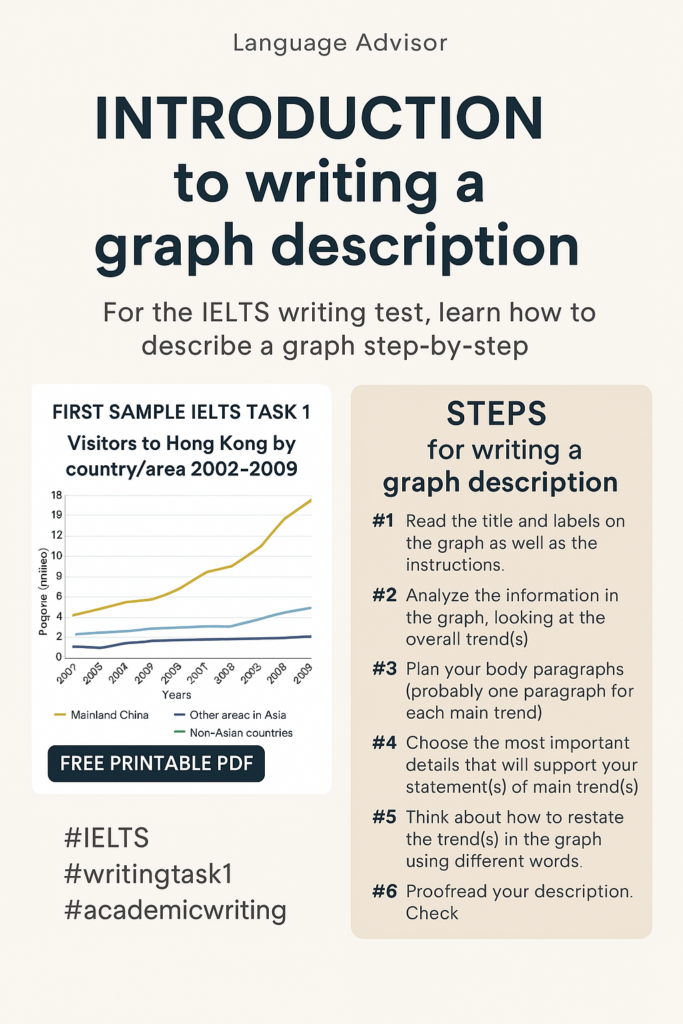
Sample IELTS Task 1 Graph: Visitors to Hong Kong (2002-2009)
The graph below illustrates the number of travelers from different regions entering Hong Kong between 2002 and 2009:
Model Answer
The graph shows the number of travelers from various parts of the world entering Hong Kong from 2002 to 2009. It is evident that the number of visitors from Mainland China increased significantly, while the figures for other Asian and non-Asian travelers showed only slight growth.
The number of Mainland Chinese visitors rose considerably over this period. In 2002, nearly 7 million visitors arrived from Mainland China, a similar figure to travelers from other parts of Asia and double that of non-Asian visitors. By 2003, this number had increased to 8 million, followed by a dramatic rise of 4 million in 2004. The upward trend continued, reaching 18 million visitors by 2009—more than double the number of Asian visitors and four times the number of non-Asian visitors.
The trends for other travelers followed a similar pattern: an initial decline from 2002 to 2003, followed by slow growth until 2007 and then stabilization. Overall, the number of Asian visitors rose from nearly 7 million in 2002 to approximately 8 million in 2009. Meanwhile, the number of non-Asian visitors increased from about 3 million to 4.5 million over the same period.
Key Takeaway
Hong Kong has become an increasingly popular tourist destination, particularly for Mainland Chinese visitors, who outnumber travelers from all other regions combined.
6 Essential Steps for Writing a Graph Description
Step 1: Analyze the Graph and Instructions
- Read the title, labels, and instructions carefully.
- Identify key trends and main features.
- Note down synonyms for key phrases to avoid repetition.
Step 2: Write a Strong Introduction
- Summarize the general trend(s) in one or two sentences.
- Avoid copying phrases from the task—paraphrase instead.
Step 3: Structure Your Body Paragraphs
- Each paragraph should focus on one main trend.
- Begin each paragraph with a topic sentence summarizing the trend.
Step 4: Include Key Data Points
- Support your analysis with numbers from the graph.
- Highlight significant increases, decreases, or stable trends.
Step 5: Write a Clear Conclusion
- Restate the overall trend using different words.
- Summarize key insights without repeating previous sentences.
Step 6: Proofread and Edit
- Check grammar, verb tenses, and sentence structure.
- Ensure logical flow and coherence with linking words.
- Verify the accuracy of figures and descriptions.
Practice Exercise: Describe a New Graph
Now, try applying these steps to a different graph! Here’s a practice question:
“The graph below shows permanent and long-term arrivals in New Zealand by country of origin from 2007 to 2009. Write a report of at least 150 words describing and comparing the data.”
Use the free printable PDF to guide your writing practice!
Final Tips for IELTS Graph Descriptions
- Use academic language and avoid informal expressions.
- Vary your sentence structure to improve readability.
- Keep your word count between 150-200 words for Task 1.
By following these steps, you’ll be well-prepared to tackle any IELTS graph description with confidence! Happy writing! 😊
📩 Want more free ESL grammar lesson? Share this post with other teachers and let us know how it worked in your classroom!
💬 What other grammar topics would you like? Drop your ideas in the comments!
DOWNLOAD THE PDF FOR FREE
More ESL Classroom Games & Activities
Looking for more fun grammar activities for your English class? Check out these ideas:
✅ ESL Speaking Games to improve fluency
✅ Grammar Board Games for practicing sentence structures
✅ Interactive Writing Activities for ESL learners